On Wednesday the NCAA released its first set of regional rankings, which provide a look at teams have the best chance of receiving at-large bids to the 2019 NCAA Tournament if they fail to win their conference’s automatic qualifying bid.
If you want to dig into the ranking process, here are a few shovels to get you started.
• NCAA Tournament FAQs
• Discuss Regional Rankings on the message board
• Regional ranking archive
The first set of publicly released regional rankings is sometimes described as a dry run because it doesn’t include one important criterion, records against regionally ranked opponents. It’s hard for the eight geographically based regional ranking committees to take that into consideration because they don’t know which teams are being ranked in other regions. And while you eventually can solve that through an iterative process on Selection Sunday, that’s not worthwhile for this first set.
But to what degree is first set of regional rankings a good predictor of which teams will eventually get one of the coveted at-large bids? I made a list of all the at-large selections over the last five seasons on the men’s side and then compared that to their regional rankings. You can download and play with that data here.
I don’t know how well the first set of regional rankings predicts which teams will get the at-large bids but it’s a very good predictor of which ones won’t. If your team wasn’t listed in the first set regional rankings, it’s almost certain they aren’t getting one of those bids, no matter what happens over the next three weeks.
For a large part of Division III, this is a missive from Captain Obvious. By virtue of their relatively low winning percentage or their weak strength of schedule, a lot of teams should already know their only path to the NCAA Tournament is the conference’s automatic qualifying bid.
But for those teams that weren’t ranked on Wednesday and are nursing hopes that they are right on the cusp of being in the at-large conversation — if they can just get hot and the right teams above them get cold – recent history is not on their side.
Over the last five seasons only three teams ultimately received at-large bids despite not appearing in the first set of regional rankings:
• New York University received an at-large bid in 2016 despite not being in the first set of East Region rankings. The East Region was also one of Division III’s smallest, so there were only six teams ranked in the East that year.
• Endicott received an at-large bid in 2017 despite not being in the first set of Northeast rankings. The Northeast is Division III’s largest region so they ranked 11 teams in 2017. The Gulls were unranked in the first set and then only ranked 10th in the next three sets of rankings. The National Committee went deep into the list of Northeast candidates that year, including taking Keene State at No. 9.
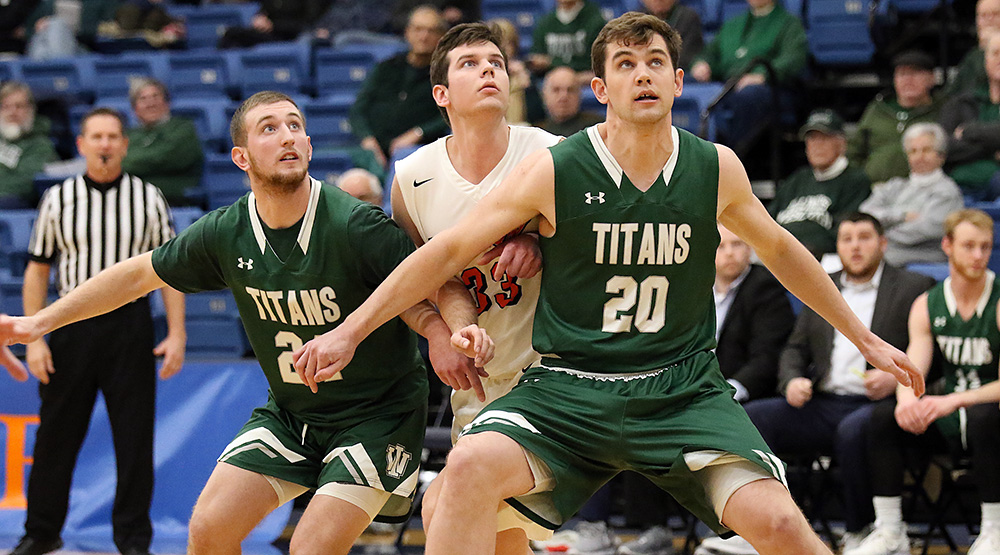
• UW-Oshkosh received an at-large bid in 2017 despite not being ranked in the first set of regional rankings. The Titans weren’t ranked in the second set of rankings either. They are the unicorn of the at-large selection process, earning an at-large bid despite finishing with double-digit losses.
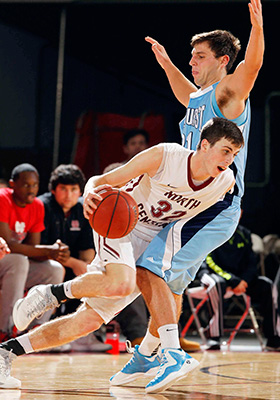
Last season was unusual in that it had two teams that appeared in the first set of regional rankings, dropped out in the second and still earned an at-large bid less than two weeks later – North Central did that in the Central and LeTourneau did that in the South.
The cut-off point for being a strong at-large candidate also differs by region. The Atlantic Region has only had four at-large bids in the last five years and only one of those bid recipients was ranked lower than third in the first set of rankings.
Based on the historical data, here are the apparent cut-off points within each region.
• Atlantic: 4 at-large bids with an average ranking of 2.8; lowest bid recipient was 2017 New Jersey City (5th)
• Central: 15 bids with an average ranking of 4.4; lowest recipient was 2017 Oshkosh (unranked)
• East: 9 bids with an average ranking of 3.3; lowest recipient was 2016 New York U (unranked)
• Great Lakes: 14 bids with an average ranking of 3.6; lowest recipient was 2015 John Carroll (8th)
• Mid Atlantic: 13 bids with an average ranking of 3.8; lowest recipient was 2018 Franklin and Marshall (7th)
• Northeast: 27 bids with an average ranking of 4.3; lowest recipient was 2017 Endicott (unranked)
• South: 8 bids with an average ranking of 4.3; lowest recipient was 2018 LeTourneau (8th)
• West: 10 bids with an average ranking of 2.4; lowest recipient was 2018 St. Olaf (4th)
So in the West region it’s not just a matter of whether you’re ranked, but whether you’re ranked in the top four teams.
Turns out that dry run is a pretty good predictor of which teams aren’t going to cross the line.

 The final public NCAA regional rankings were released Wednesday afternoon. The committees create one more ranking on Sunday, March 1, but do not release it to the public.